
Die Sonne ist von der Erde aus gesehen der nächstgelegene Stern. Die Sonne bildet das Zentrum unseres Sonnensystems. Je nach Standort der Erde auf ihrer Ellipsenbahn um die Sonne messen wir unterschiedliche Distanzen. Im Perihel beträgt die Distanz 147.1 Millionen km. Im Aphel 152.1 Millionen km. Das Licht von der Sonne braucht also ca. 8.17 bis 8.45 Minuten bis es die Erde erreicht. Für die Amateur-Astronomen ist die Sonne der Ort wo die Party abgeht. Auf der Sonne ist immer etwas los. Auf der einen Seite kann man Sonnenflecken beobachten und mit geeigneter Spezialausrüstung sogar die Corona und Flares beobachten. Der Durchmesser der Sonne beträgt 1`392`520 km das sind 109 Erddurchmesser. Sie wiegt soviel wie 333`000 Erden zusammen und trotzdem ist sie eigentlich nur ein kleiner Stern.
The Sun is the closest star as seen from Earth. The sun is the center of our solar system. Depending on the location of the Earth on its ellipse orbit around the Sun, we measure different distances. In perihelion, the distance is 147.1 million km. In aphelion 152.1 million km. The light from the sun takes about 8.17 to 8.45 minutes to reach the earth. For the amateur astronomers, the sun is the place where the party goes off. There is always something going on in the sun. On the one hand, you can observe sunspots and even observe the corona and flares with suitable special equipment. The diameter of the Sun is 1'392'520 km which is 109 Earth diameters. It weighs as much as 333,000 Earths together and yet it is actually only a small star.

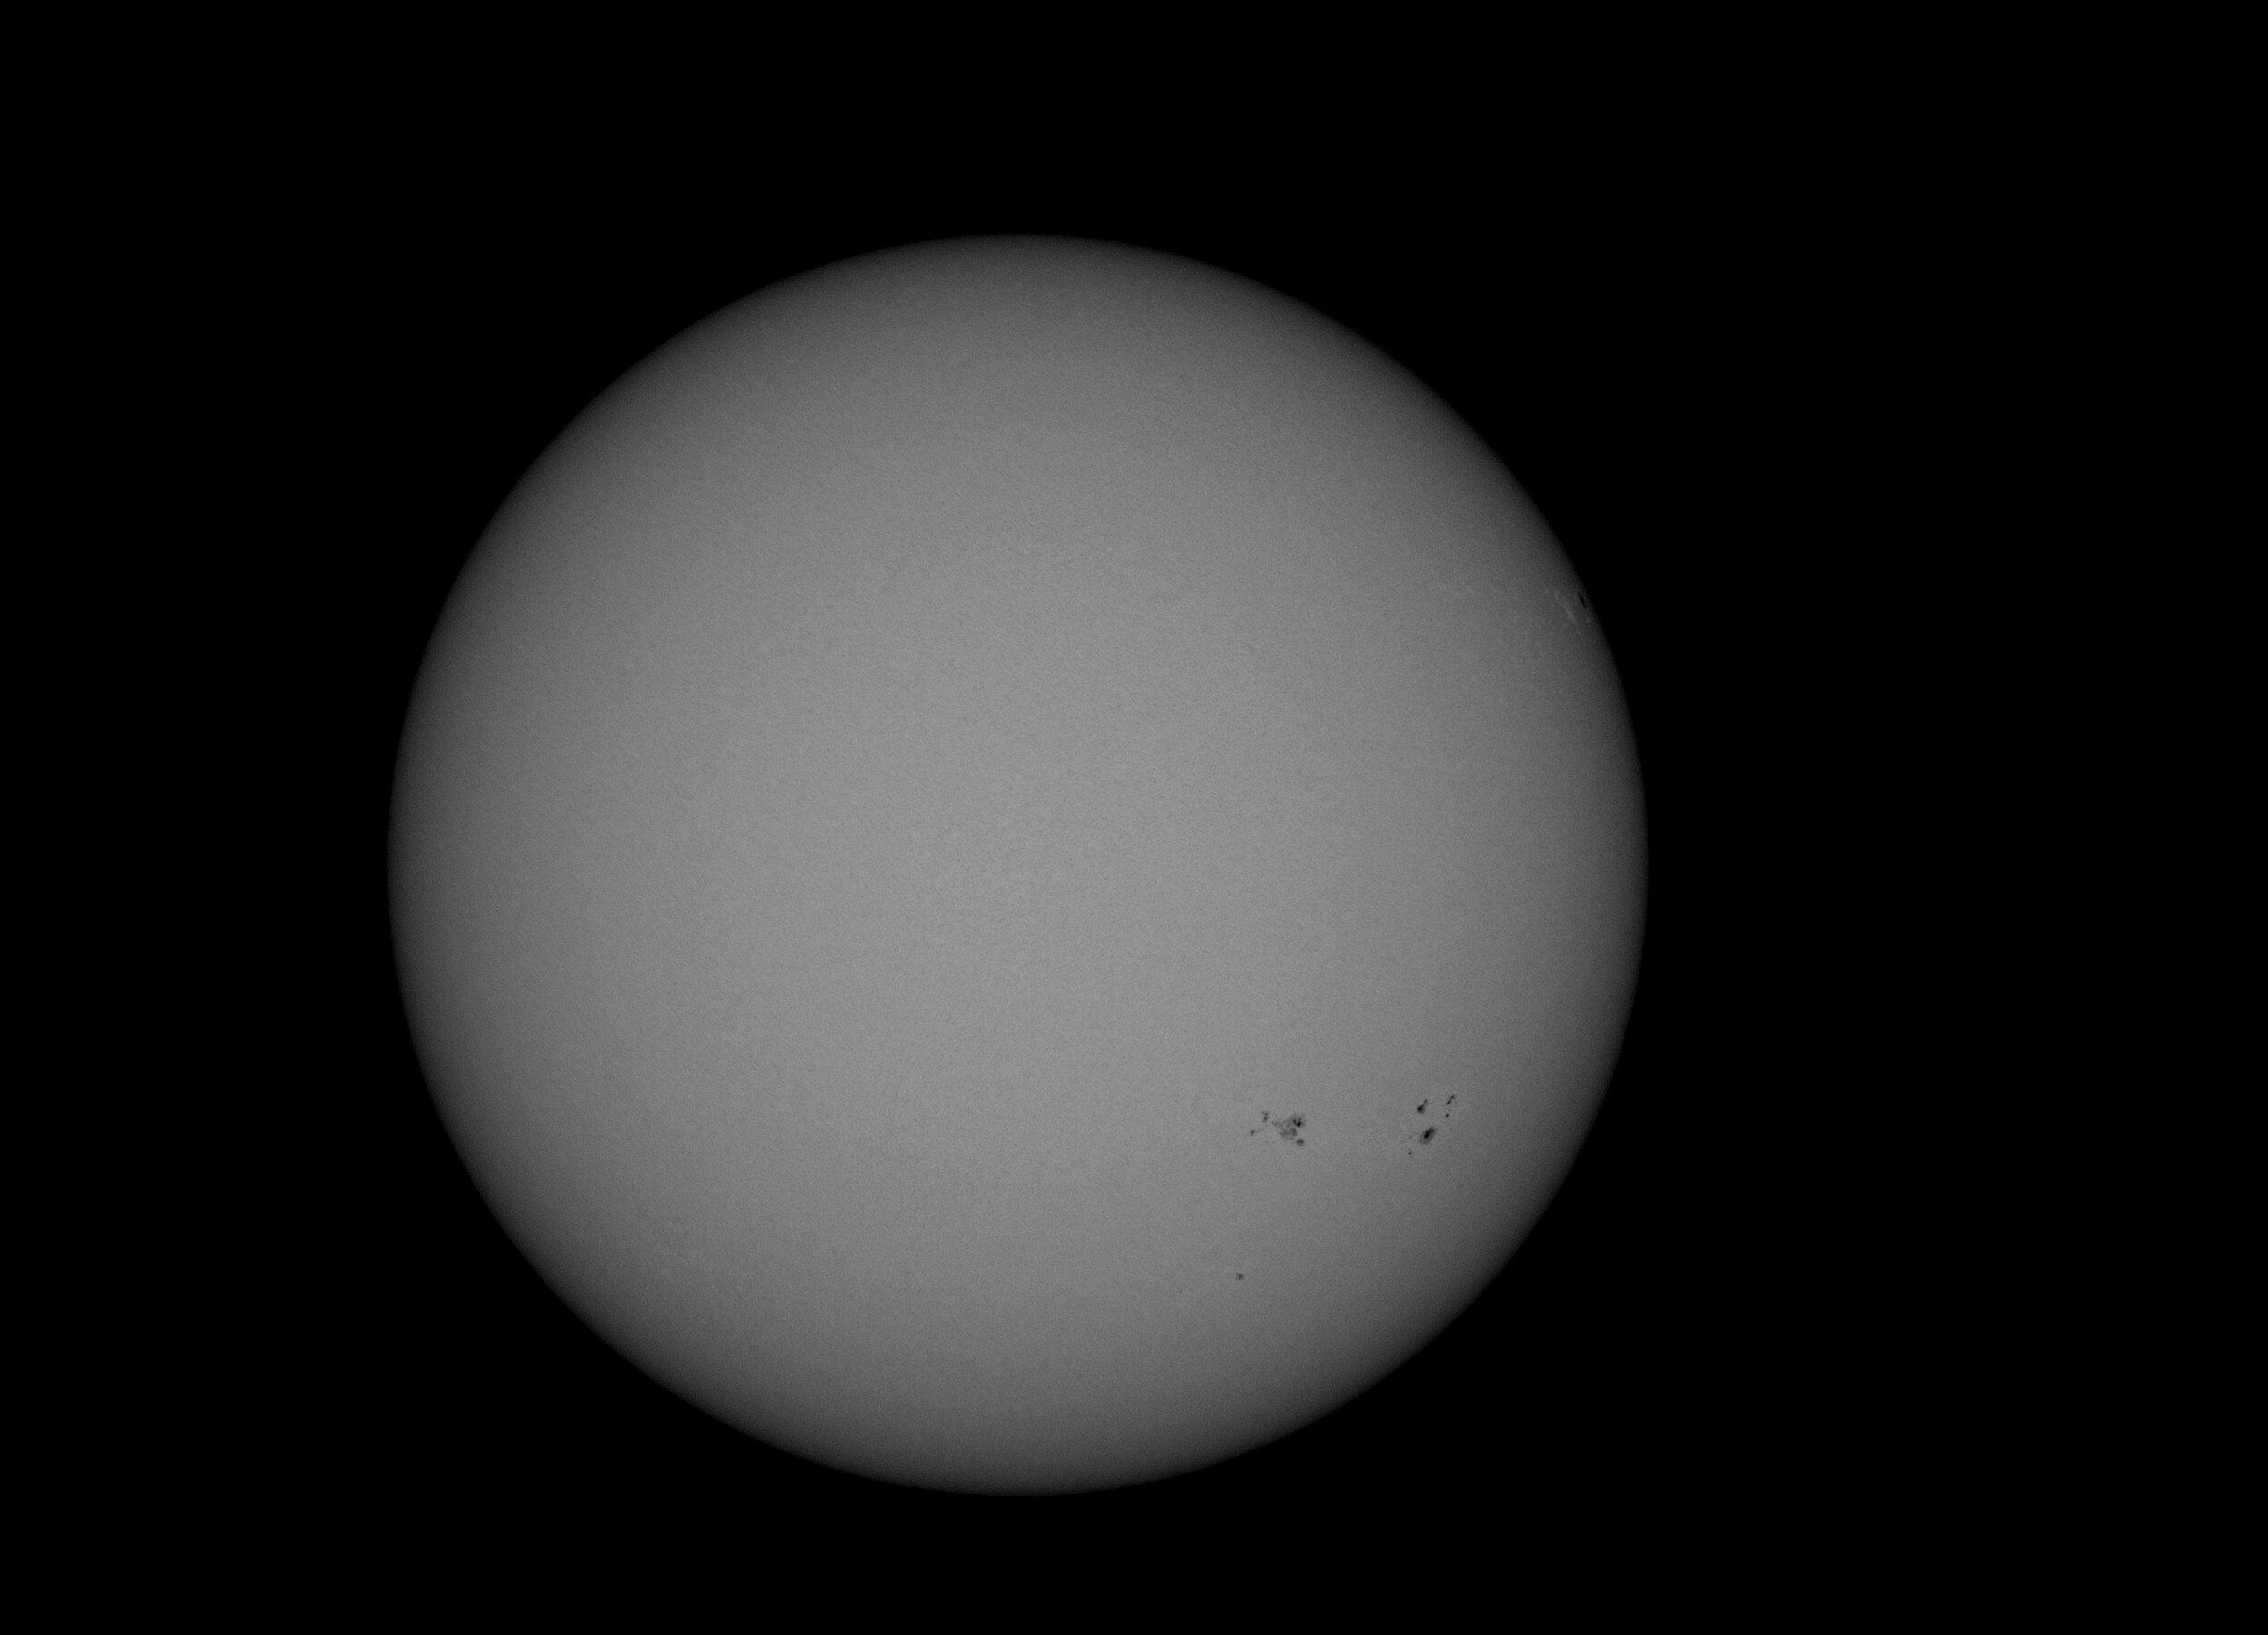
Sonnenfleckengebiet auf der Sonne. Die Umbra des grossen Sonnenfleckes hat einen Durchmesser von ca. 20`000 km. Unsere Erde würde also locker darin Platz finden. Auch sehr schön zu sehen sind die Lichtbrücken im Fleck links.
Das Licht das wir auf unserer Erde empfangen stammt von unserer Sonne. Der weitaus grösste Teil wird in der Photosphäre der Sonne emittiert. Die Photosphäre ist die unterste beobachtbare Schicht eines Sterns. Bei unserer Sonne ist Sie ca. 300 km bis 400 km dick und hat eine Temperatur von ca. 5200° C - 5700° C. Tiefer liegende Schichten eines Sterns können nicht direkt beobachtet werden, da die von dort stammenden Photonen von den Elektronen im Sternplasma gestreut werden.
The light we receive on our earth comes from our sun. The vast majority is emitted in the photosphere of the sun. The photosphere is the lowest observable layer of a star. With our Sun it is about 300 km to 400 km thick and has a temperature of about 5200 ° C - 5700 ° C. Deeper layers of a star can not be observed directly, because the photons originating from there are scattered by the electrons in the stellar plasma.
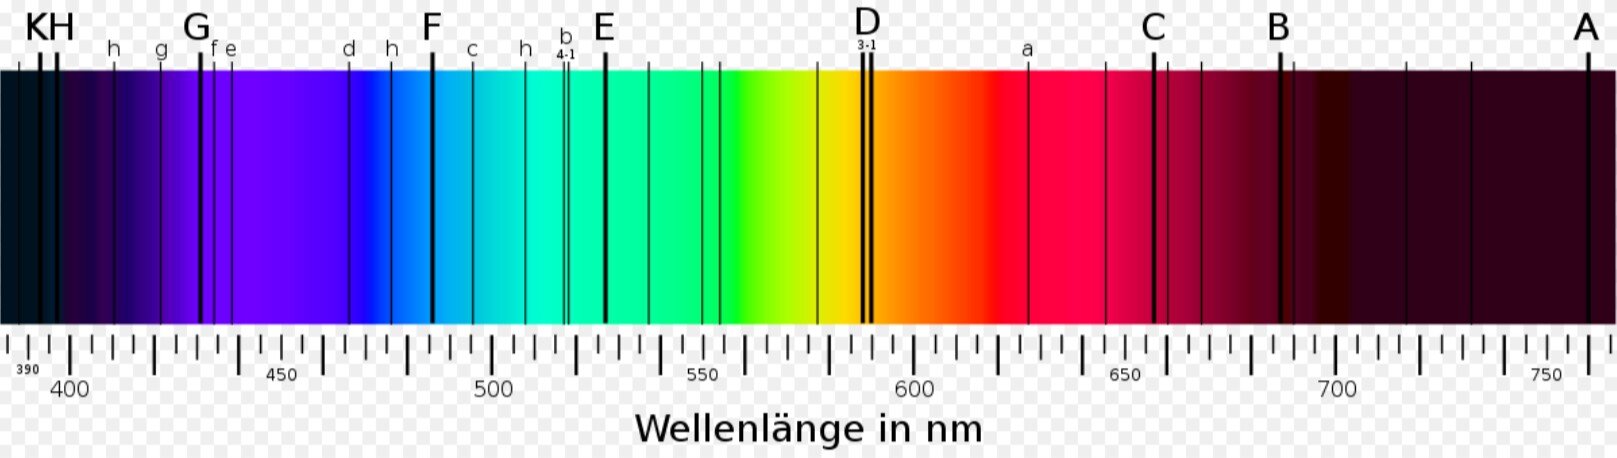
Lichtspektrum der sichtbaren elektromagnetischen Strahlung inklusive Fraunhoferlinien.
Light spectrum of visible electromagnetic radiation including Fraunhofer lines.
Jedes chemische Element hat sein eigenes Emissionsspektrum. Die einzelnen Spektrallinien des Spektrums entsprechen dabei jeweils der Energiedifferenz zwischen zwei verschiedenen Zuständen des Atoms. Die schwarzen Linien repräsentieren die verschiedenen Energiezustände des Elektrons im Atom. Diese Energiedifferenz ist diskret, kann also nicht beliebige Werte annehmen, so dass jedes Atom entsprechend seiner spezifischen Elektronenkonfiguration nur Photonen ganz bestimmter, diskreter Wellenlängen emittieren kann. Durch die Absorption eines Lichtquants mit einer Wellenlänge von 656,278 nm wechselt ein Elektron eines Wasserstoffatoms das Orbital. Dieses Ereignis bildet die Fraunhofer-Linie C. Diese Linie wird auch mit H-Alpha bezeichnet.
Oberhalb der direkt beobachtbaren Photosphäre befindet sich die sogenannte Chromosphäre der Sonne, diese erstreckt sich ca. 2000 km in den Raum und lässt sich nur noch im H-Alpha Bereich beobachten. Die Gasdichte der Chromosphäre nimmt mit zunehmender Höhe ab und ist um einiges geringer als in der Photosphäre. Die Temperatur der Chromosphäre im Grenzbereich zur Photosphäre ist ca. 1000° C geringer, nimmt aber mit zunehmender Höhe auf bis 10`000 ° C zu. In dieser Schicht werden Photonen die zuvor absorbiert wurden durch den erneuten Orbitalwechsel der Elektronen mit genau der gleichen Wellenlänge von 656.278 nm emittiert. So entsteht die Fraunhofer-Linie C.
Each chemical element has its own emission spectrum. The individual spectral lines of the spectrum correspond to the energy difference between two different states of the atom. The black lines represent the different energy states of the electron in the atom. This energy difference is discrete, so it cannot assume arbitrary values, so that each atom can only emit photons of very specific, discrete wavelengths according to its specific electron configuration. By absorbing a light quantum with a wavelength of 656.278 nm, an electron of a hydrogen atom changes orbital. This event forms the Fraunhofer line C. This line is also referred to as H-alpha.
Above the directly observable photosphere is the so-called chromosphere of the sun, which extends about 2000 km into space and can only be observed in the H-alpha range. The gas density of the chromosphere decreases with increasing altitude and is much lower than in the photosphere. The temperature of the chromosphere at the interface to the photosphere is about 1000 ° C lower, but increases with increasing altitude to up to 10'000 ° C. In this layer, photons that have previously been absorbed by the renewed orbital change of electrons are emitted with exactly the same wavelength of 656,278 nm. This is how the Fraunhofer Line C is created.
Die Korona ist die äusserste Gashülle unserer Sonne. Die Korona ist nur sichtbar wenn die Photosphäre der Sonne abgedeckt wird (Spezialokulare / Koronographen / Sonnenfinsternis). Sie erstreckt sich ca. 1 Million km in den Raum hinein und ist äusserst Heiss ( 1 bis 3 Millionen °C ) obwohl die Gasdichte nochmals drastisch abnimmt. Dieser Effekt kann bis heute nicht vollständig erklärt werden.
The corona is the outermost gas envelope of our Sun. The corona is only visible when the photosphere of the sun is covered (special eyepieces / coronagraphs / solar eclipse). It extends about 1 million km into the room and is extremely hot ( 1 to 3 million °C ) although the gas density decreases again drastically. To this day, this effect cannot be fully explained.

Sonnenrotation und Zyklen / Sun rotation and cycles
Unsere Sonne rotiert, genau wie die Erde, um Ihre eigene Achse und zwar im gleichen Sinn wie die Planeten sie umkreisen mit einer Neigung von 7.25° zur Ekliptik. Jedoch ist die Rotation nicht wie bei der Erde starr, sondern man spricht von einer Differenziellen Rotation die von Richard Christopher Carrington um 1853 entdeckt wurde. Dies hat seinen Ursprung darin, das die Sonne ein Gasball ist. Die höchste Rotationsgeschwindigkeit misst man am Äquator der Sonne. Je weiter man zu den Polen gelangt desto langsamer wird die Rotation. Carrington entwickelte eine mathematische Formel zur Berechnung der differenziellen Rotation in Abhängigkeit des Breitengrades (Carrington Formel). Am Äquator beträgt die Rotationszeit 27.2753 Tage (Synodisch) das sind 27 Tage 6 Stunden 36 Minuten 25.92 Sekunden. Die Rotationen der Sonne werden seit 1853 fortlaufend (Carrington Rotation) gezählt. Im Moment (25.07.2021) sind wir in der Carrington Rotation Nr. 2247.
Our sun, just like the Earth, rotates around its own axis in the same sense as the planets orbit it with an inclination of 7.25° to the ecliptic. However, the rotation is not rigid as with the Earth, but one speaks of a differential rotation discovered by Richard Christopher Carrington around 1853. This has its origin in the fact that the sun is a ball of gas. The highest rotational speed is measured at the equator of the Sun. The further you get to the poles, the slower the rotation becomes. Carrington developed a mathematical formula for calculating the differential rotation as a function of latitude (Carrington formula). At the equator, the rotation time is 27.2753 days (Synodic) which is 27 days 6 hours 36 minutes 25.92 seconds. The rotations of the Sun have been counted continuously since 1853 (Carrington Rotation). At the moment (25.07.2021) we are in the Carrington Rotation No. 2247.

Richard Christopher Carrington (* 26. Mai 1826 in Chelsea; † 27. November 1875 in Redhill, Surrey, England) war ein englischer Astronom.
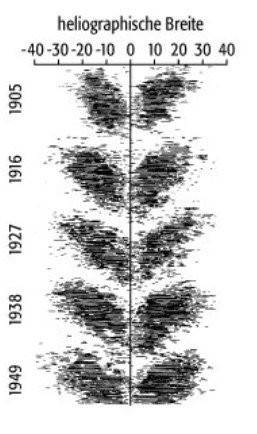
Als Sonnenzyklus wird die elf Jährige Periode der Sonnenfleckenbildung verstanden. In einem Zyklus steigt die Anzahl von Sonnenflecken von einem Minimum zu einem Maximum. Zu beginn einer solchen Periode bilden sich nur wenige Sonnenflecken in einer Zone von 30° bis 35° Breite nördlich und südliche des Äquators. Die Pole selbst bleiben stets Fleckenfrei. Mit der Zunahme der Fleckenbildung wandern diese immer näher an den Äquator. Zeichnet man diesen Zyklus auf, so entsteht ein sogenanntes “Schmetterlingsdiagramm”. Es trägt diesen Namen, da die Breitenverteilung der Sonnenflecken, dargestellt über einen Sonnenfleckenzyklus, die Form eines Schmetterlings hat.
The solar cycle is the eleven-year period of sunspot formation. In one cycle, the number of sunspots increases from a minimum to a maximum. At the beginning of such a period, only a few sunspots form in a zone of 30° to 35° latitude north and south of the equator. The poles themselves always remain stain-free. With the increase in spotting, they move closer and closer to the equator. If this cycle is recorded, a so-called "butterfly diagram" is created. It bears this name because the latitude distribution of sunspots, represented by a sunspot cycle, has the shape of a butterfly.
Sonnenflecken werden von Magnetfeldern von einigen tausend Gauss hervorgerufen. (Gauss ist die Einheit der magnetischen Flussdichte) Sonnenflecken haben die Tendenz zur Gruppenbildung und entwickeln dabei eine bipolare Struktur. Haben Flecken auf der Nordhalbkugel eine positive (Nordpol) Polarität, so weisen in Rotationsrichtung nachfolgende Flecken, negative (Südpol) Polarität auf. Auf der Südhalbkugel ist es genau umgekehrt. Nach einem Sonnenfleckenzyklus von ca. 11 Jahren polt sich das Magnetfeld der Sonne um und beim neuen Zyklus ist die Polarität der Sonnenflecken genau umgekehrt. So reden wir hier eigentlich von einem 22 Jährigen Zyklus.
Sunspots are caused by magnetic fields of several thousand Gauss. (Gauss is the unit of magnetic flux density) Sunspots have a tendency to form groups and develop a bipolar structure in the process. If spots in the northern hemisphere have a positive (north pole) polarity, subsequent spots have negative (south pole) polarity in the direction of rotation. In the southern hemisphere, it is exactly the opposite. After a sunspot cycle of about 11 years, the sun's magnetic field reverses its polarity and in the new cycle, the polarity of the sunspots is exactly the opposite. So we're actually talking about a 22-year cycle.

Tageszusammenfassung einer Session mit NOAA Daten und Vergrösserung.


Lokalisierung und Vermessung von Sonnenflecken. Auf den beiden untenstehenden Bildern wird die differentielle Rotation der Sonne sichtbar. Die Bilder entstanden innerhalb von 24 Stunden.

NOAA Region 12936 am 29.01.2022. Das Fleckenzentrum befindet sich 16° Nord und 13° East.

NOAA Region 12936 am 29.01.2022. Das Fleckenzentrum befindet sich 17° Nord und 1° West.
Videofile des ISS Transits vom 22.02.2022. (MEADE 10” SC, Canon EOS Ra)
Spurbild des ISS Transits vom 26.02.2022. Das Video wurde am Standort 47° 10` 2.1`` N und 7° 24`29.79`` E aufgenommen. (Mit freundlicher Genehmigung der “Häni Metallbau AG in Staad)
Spurbild des ISS Transits vom 16.04.2022. Das Video wurde am Standort 47° 05` 4.47`` N und 7° 24`16.58`` E aufgenommen.
Spurbild des ISS Transits vom 09.04.2023. Das Video wurde am Standort 49° 54` 1`` N und 7° 20`5`` E aufgenommen.
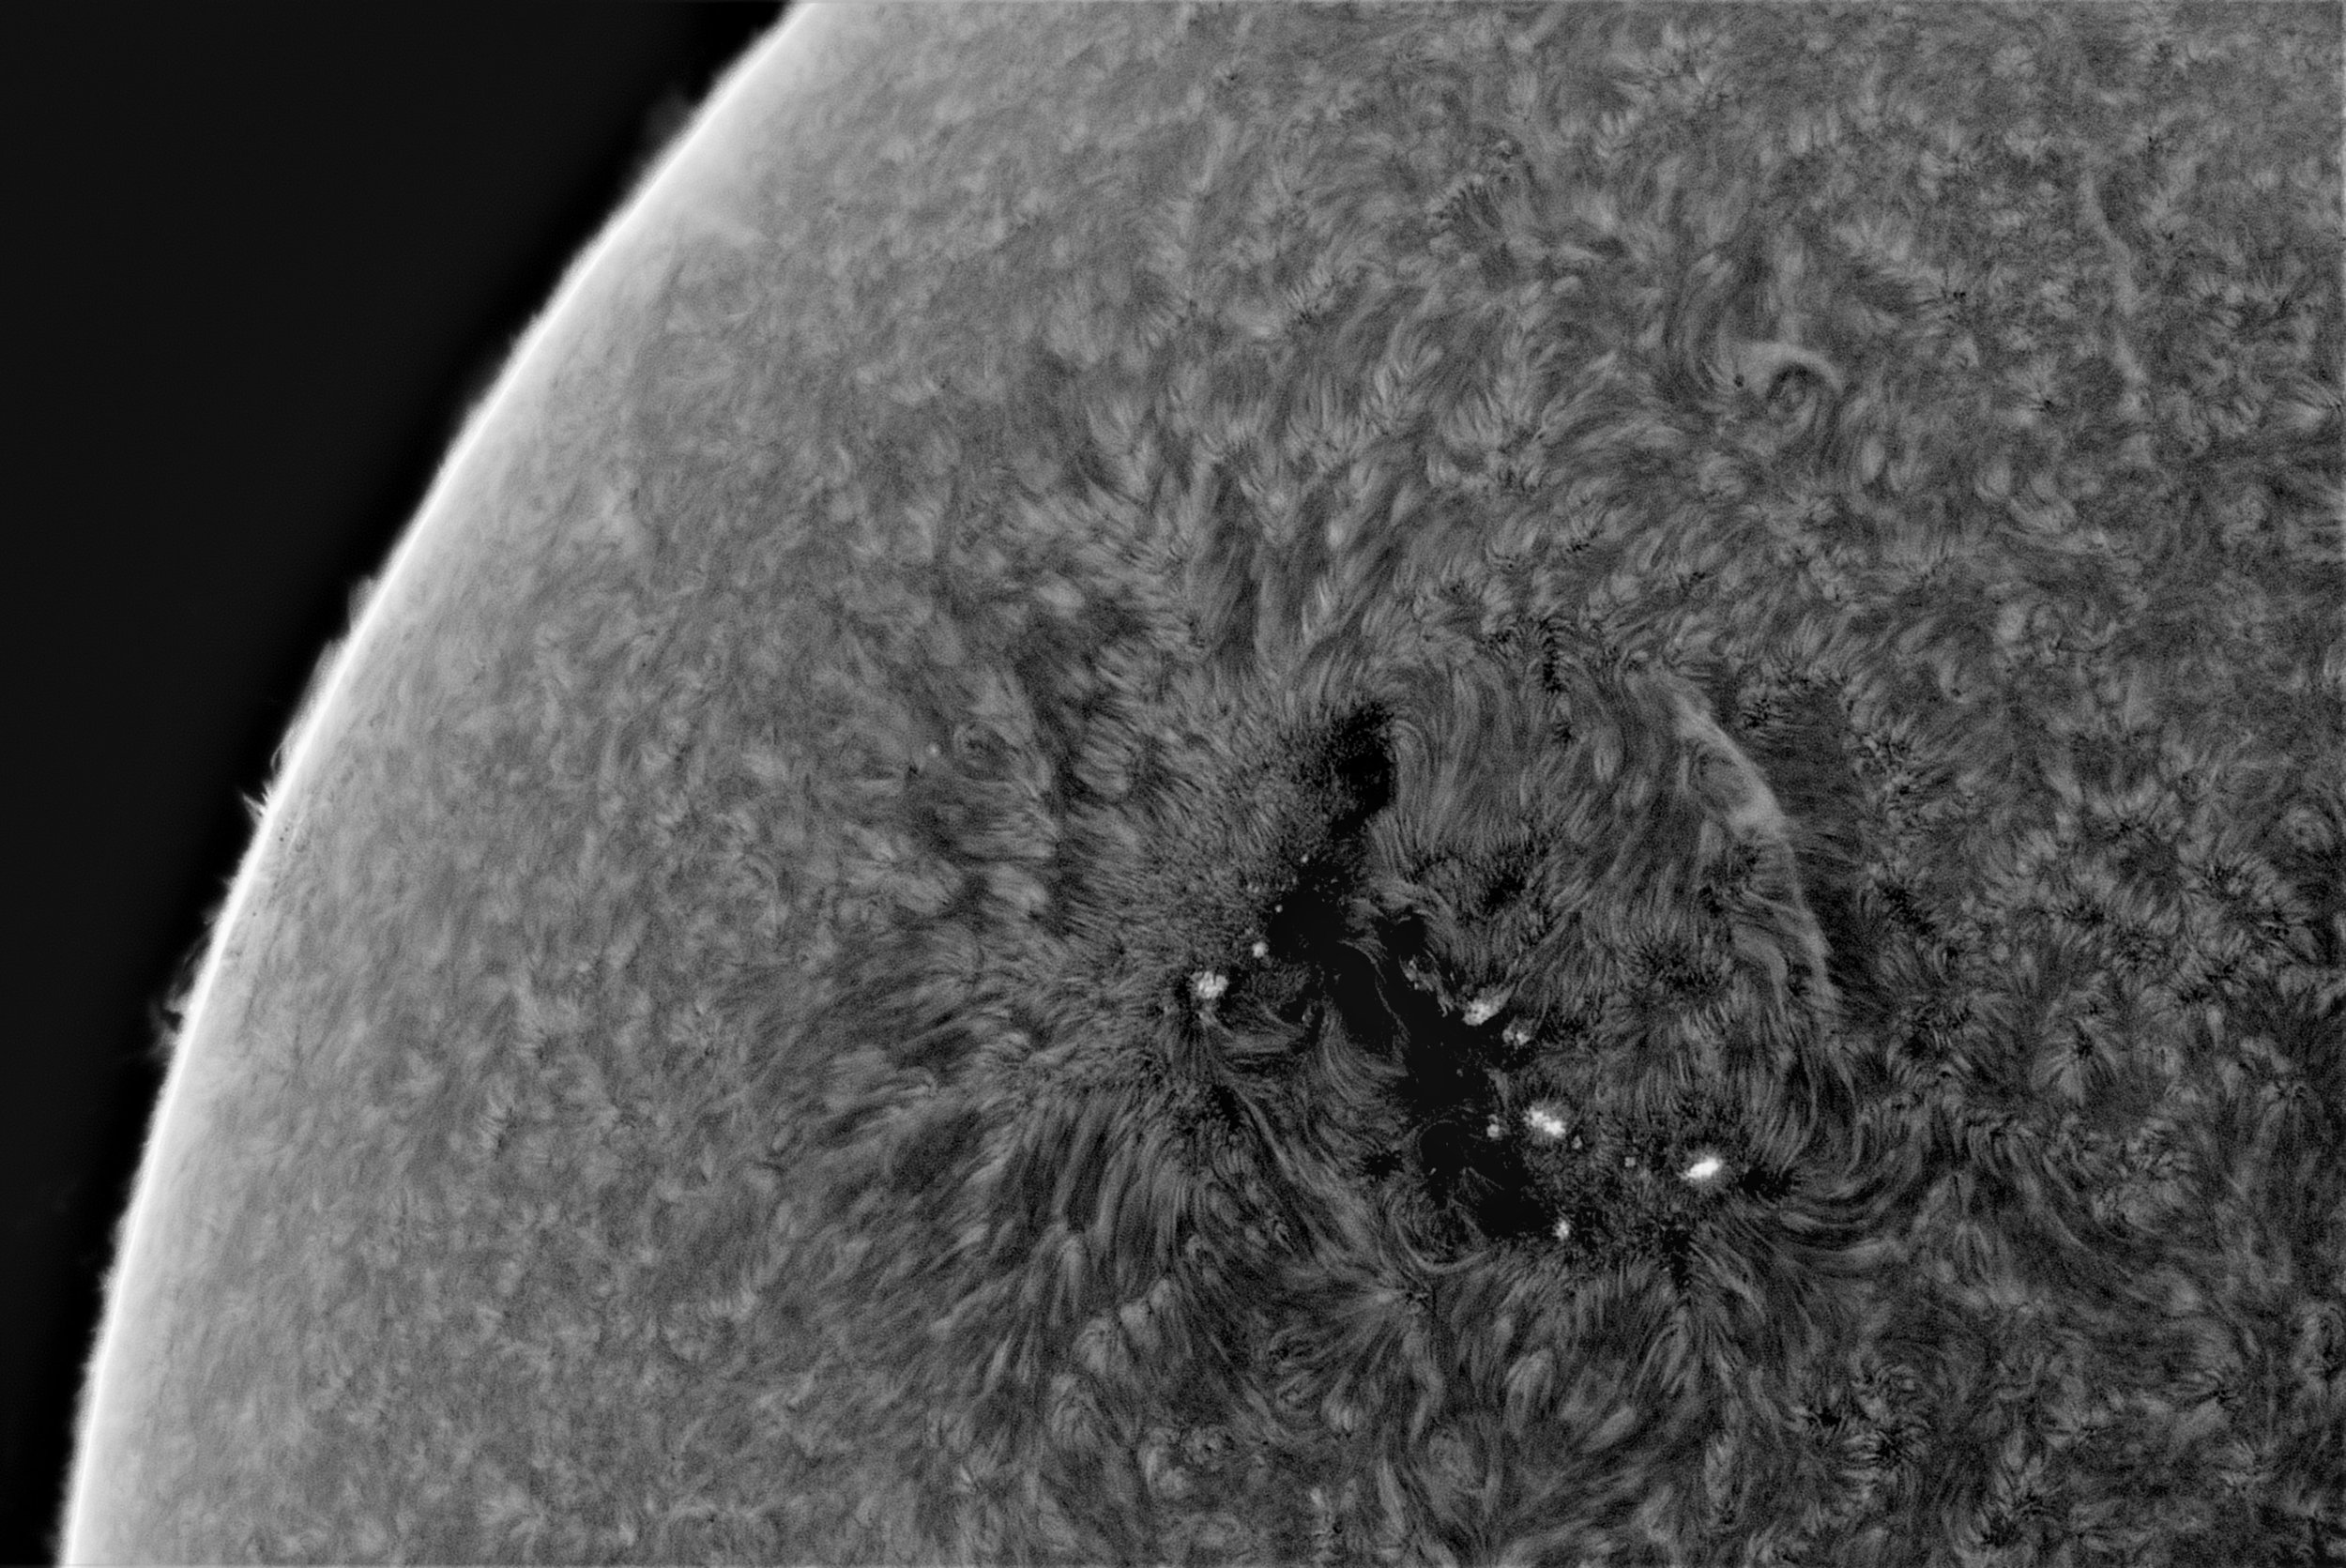
Aufnahme der Sonne in H-Alpha mit einem Solar Spectrum Filter 0.5 Ångström. Die H-Alpha Linie des Spektrums befindet sich genau bei 656,28 Nanometern. Der Filter lässt also nur Licht passieren in einer Breite von 0.05 Nanometern.